Updated 20 July 2026 · By the CarsMultiverse Research Team
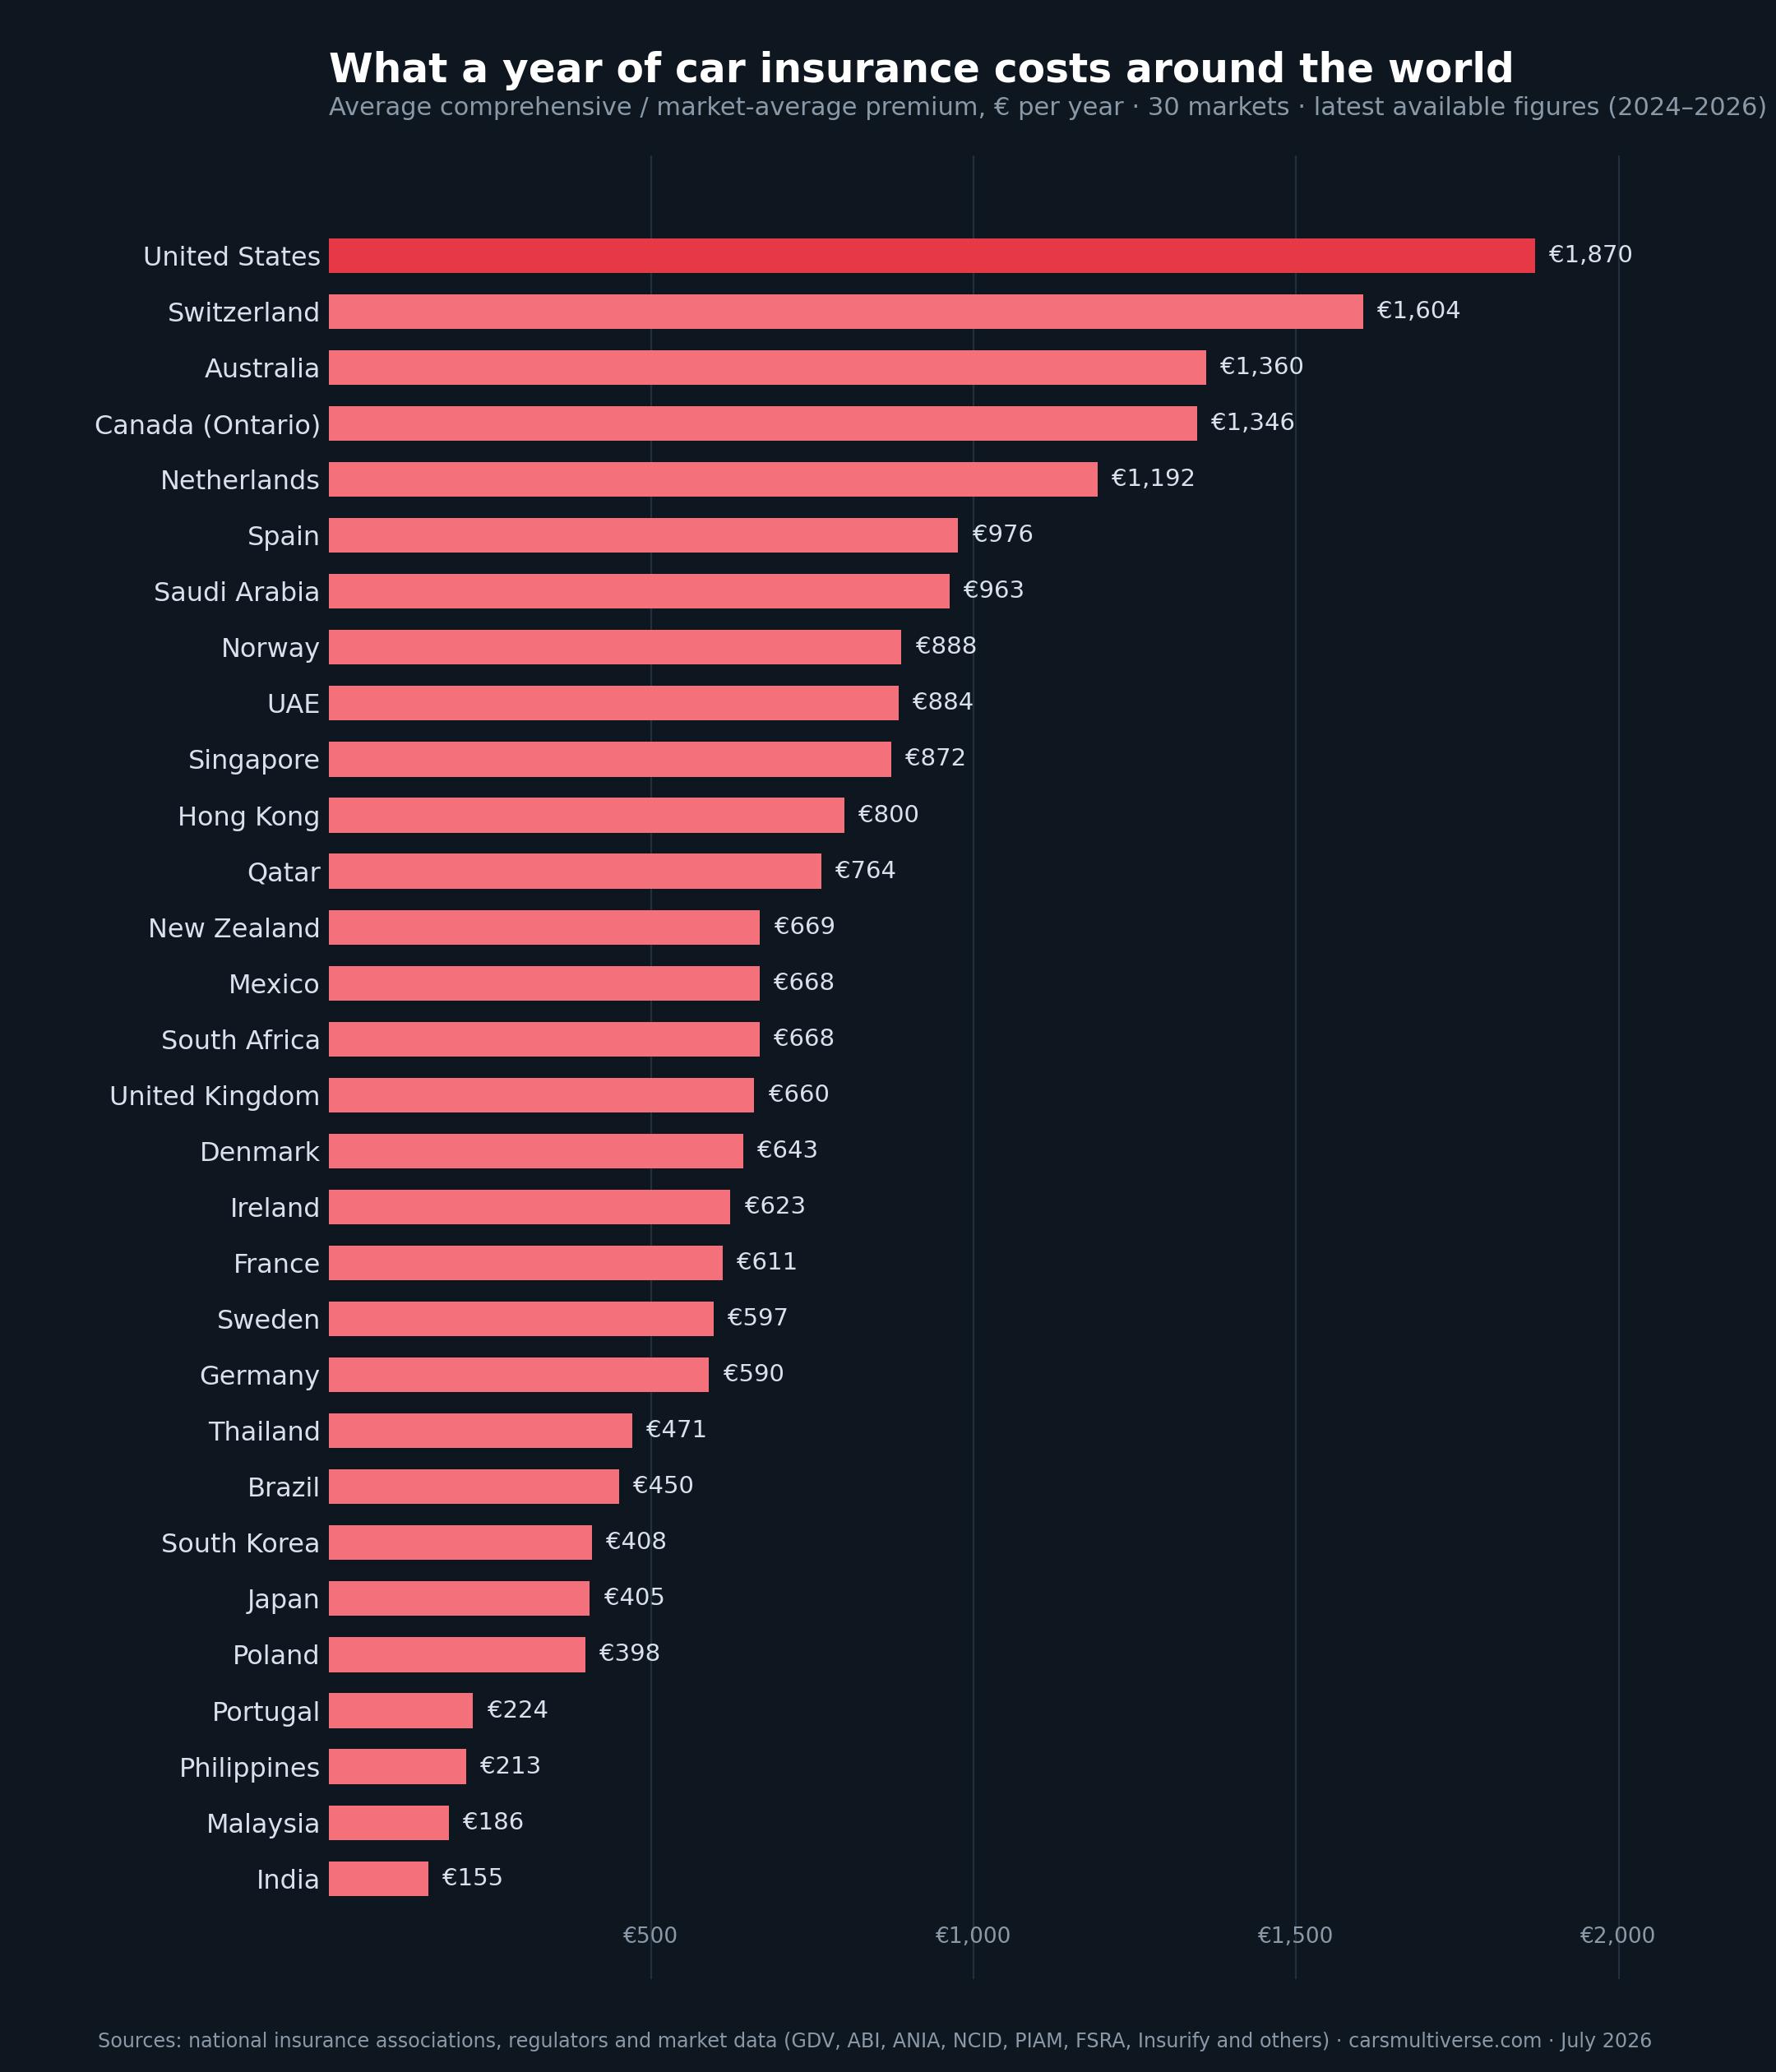
The average American driver now pays about €1,870 (US$2,144) a year for full car insurance cover — twelve times what a driver in India pays to fully insure a mid-size car (€155), and more than three times the German market average (€590). We compared what drivers actually pay for car insurance in 36 markets, using national insurance associations, regulators and market data. This is the widest public comparison of its kind we know of — and the gaps are enormous.
Key findings
• The United States is the most expensive market we measured: €1,870 a year for average full coverage (Insurify, 2025), with Washington D.C. alone averaging over €3,500. Switzerland (€1,604 full casco) and Australia (€1,360 comprehensive) follow.
• The cheapest legal minimum on Earth is Thailand’s: the state-fixed CTPL policy costs ฿645 — about €17 a year. Japan’s compulsory CALI cover is around €52 a year. At the other end, Dutch drivers pay €1,179 just for mandatory third-party cover — a 69× gap between rich-world neighbours in what the law obliges you to buy.
• Neighbours diverge wildly: Spain’s blended average (€976) is over four times Portugal’s (€224). Ontario drivers pay roughly double what most other Canadian provinces do.
• 2026 is a split market: UK premiums are falling (£560, down £30 year-on-year — ABI), while Dutch premiums jumped 9.2% in Q1 2026, German premiums rose ~11% in 2025, South Korea approved its first rate rise in five years (Feb 2026) and Japan raises CALI for the first time in 13 years this November.
• Huge parts of the world drive uninsured: roughly 1 in 3 US drivers is uninsured or under-insured (IRC), only ~29% of Brazil’s 63-million-vehicle fleet carries private cover (CNseg), and most South African vehicles are uninsured.
↓ Download the full dataset (CSV, free reuse with attribution)
The full comparison: 36 markets
Figures are the latest available average annual premiums, converted to euros. “Blended” means the source averages across all cover levels. Where a country has no meaningful comprehensive average, we show the mandatory-cover figure and say so.
| Country | Comprehensive / market avg (€/yr) | Mandatory cover only (€/yr) | Figure year | Source type |
|---|---|---|---|---|
| United States | €1,870 | €715 (min. liability) | 2025 | Market data (Insurify, Bankrate; NAIC $1,282 actual 2023) |
| Switzerland | €1,604 | €519 | 2025 | Market data (FinanceScout24) |
| Australia | €1,360 | CTP paid with registration | 2025 | Market data (Canstar) |
| Canada (Ontario) | €1,346 | included | 2025 | Official (FSRA Ontario) |
| Netherlands | €1,192 | €1,179 (WA) | 2025 | Market data (Geld.nl) |
| Spain | €976 (blended) | – | 2025 | Market data (Kelisto) |
| Saudi Arabia | €963 | €282 | 2026 | Market data (brokerage midpoints) |
| Norway | €888 (blended) | – | 2025/26 | Finans Norge (via press) |
| UAE | €884 | €404 | 2026 | Market data (midpoints) |
| Singapore | €872 (per vehicle) | – | 2025 | Derived: GIA premiums ÷ LTA fleet |
| Hong Kong | €800 (all vehicle classes) | – | 2024 | Derived: Insurance Authority ÷ fleet |
| Qatar | €764 | €134 | 2026 | Market data (midpoints) |
| New Zealand | €669 | no compulsory cover (ACC) | Q2 2026 | Market data (Quashed index) |
| Mexico | €668 | €332 (RC) | 2025 | Market data (Rastreator) |
| South Africa | €668 | from ~€42 (third-party only) | 2026 | Market data (Naked) |
| United Kingdom | €660 (price paid) | – | Q1 2026 | Official (ABI Premium Tracker) |
| Denmark | €643 (blended) | – | 2026 | Market estimate |
| Ireland | €623 (all private motor) | – | 2024 | Official (Central Bank NCID) |
| France | €611 (blended) | – | 2026 | Market data (LeLynx barometer) |
| Sweden | €597 (fully insured) | – | 2025 | Market data (Compricer) |
| Germany | €590 (full casco) | €256 | 2025 | Official (GDV) |
| Thailand | €471 (Class 1) | €17 (CTPL, state-fixed) | 2025 | OIC (CTPL) + market (Class 1) |
| Brazil | €450 | no private mandate | Jan 2026 | Market data (Creditas survey) |
| South Korea | €408 (standard policy) | included | 2024 | Industry via press |
| Japan | €405 (voluntary avg) | €52 (CALI) | 2025/26 | GIROJ (CALI) + market (voluntary) |
| Poland | €398 (OC+AC) | €154 (OC) | Q2 2026 | Market data (CUK) |
| Portugal | €224 (per insured vehicle) | – | 2024 | Derived from ASF statistics |
| Philippines | €213 | €21 (CTPL) | 2024 | Market data (midpoints) |
| Malaysia | €186 (avg private car) | included | 2024 | Official (PIAM) |
| India | €155 (mid-size, comp.) | ~€40 (IRDAI-fixed TP) | 2024 | Regulated TP + market comp. |
| Italy | MTPL only: €415 | €415 | 2025 | Official (ANIA) |
| Austria | MTPL only: ~€420 | ~€420 | 2024 | Derived from VVO totals |
| Belgium | MTPL only: €320 (ex-VAT) | €320 | 2024 | Official (Assuralia) |
| Turkey | MTPL only: €159 | €159 (state-capped) | Dec 2025 | Official-capped (SBM) |
| Finland | no comparable average | – | 2024 | Finanssiala publishes aggregates only |
| Indonesia | % of car value (OJK tariff) | – | 2025 | Not comparable by design |
Why the gaps are so large
Claims costs dominate. The US combines litigation-heavy bodily-injury claims, high repair costs and severe weather losses — and average premiums track those costs almost mechanically. The UK’s recent price falls came only after two years of steep rises rebuilt insurer margins.
What the law makes you buy differs. The Netherlands, Belgium and Germany oblige only third-party liability, but Dutch liability premiums alone exceed €1,100 because injury liability is effectively unlimited and repair labour is expensive. Thailand and India fix mandatory premiums by decree at token levels — the real cost shows up only when drivers buy voluntary comprehensive cover.
Some systems socialise the risk. New Zealand has no compulsory car insurance at all: the national ACC scheme pays for injuries regardless of fault, so drivers only insure the metal. Quebec does something similar for bodily injury, which is why it has Canada’s cheapest premiums while Ontario has among the dearest.
Vehicle values matter as much as risk. Indonesia prices motor insurance as a regulated percentage of the car’s value — there is literally no flat average to quote. Gulf-state comprehensive cover runs 1.5–4% of vehicle value, so a €25,000 car costs roughly the global mid-range to insure despite cheap workshops.
Methodology
We collected the most recent published average annual private-car insurance premium for each of the 36 countries CarsMultiverse tracks (figures dated 2024–2026, gathered July 2026). We prefer, in order: (1) regulator or national insurance-association averages (GDV Germany, ABI UK, ANIA Italy, Central Bank of Ireland NCID, Assuralia Belgium, PIAM Malaysia, FSRA Ontario, GIROJ Japan, OIC Thailand); (2) figures derived from official aggregate premiums divided by official fleet counts (Singapore, Hong Kong, Portugal, Austria); (3) large comparison-market or brokerage survey averages, clearly labelled (US, France, Spain, Netherlands, Sweden, Denmark, Switzerland, Gulf states, Latin America, South-East Asia). Local currencies were converted at ECB reference rates, mid-July 2026. Cover levels are not identical between countries — the table states what each figure represents, and four countries are shown as mandatory-cover-only because no reliable comprehensive average exists. Finland and Indonesia are listed without a headline figure rather than guessed; where our 5-Year TCO Index requires an insurance figure for all 36 countries, it applies a modelled estimate for these two (roughly €950 and €600 a year respectively) rather than a published market average. Full per-country sourcing is in the CSV.
FAQ
Which country has the most expensive car insurance?
Among the 36 markets we compared, the United States has the highest average premium: about €1,870 (US$2,144) a year for full coverage in 2025, per Insurify’s national analysis. Switzerland is second at roughly €1,604 for full casco cover.
Which country has the cheapest car insurance?
For legally required cover, Thailand: the state-fixed CTPL premium is about €17 a year. For full comprehensive cover, India is cheapest in our set — roughly €155 a year for a mid-size car.
Can these figures be compared directly?
Only with care. Countries mandate different cover (third-party liability vs none at all), and sources differ — some are regulator averages of prices actually paid, others are comparison-site quote averages. Our table labels the cover level and source type for every figure, and the CSV carries full notes.
Are car insurance prices rising or falling in 2026?
Both, depending where you are. The UK average fell to £560 in Q1 2026 (down £30 year-on-year), while the Netherlands rose 9.2% in one quarter, Germany rose about 11% in 2025, and South Korea and Japan are both raising rates in 2026 after years of freezes.
Explore more CarsMultiverse research
• Car tax by country 2026: where the state adds the most to a new car
• Petrol vs hybrid vs plug-in vs electric: running costs in 36 countries
• Car insurance estimator (free tool)
• How much does car insurance cost in the US? and US costs by state
• How car insurance systems differ around the world
• All research & data
Disclaimer & reuse. This comparison is for information only and is not financial or insurance advice; always verify premiums with insurers or official bodies in your country. Figures are averages — your own premium depends on your profile, vehicle and location. Data compiled from the sources named above; charts, tables and the CSV are free to reuse with attribution and a link (CC BY 4.0). See our Terms of Service.