Updated 20 July 2026 · By the CarsMultiverse Research Team · First edition — refreshed with each underlying dataset
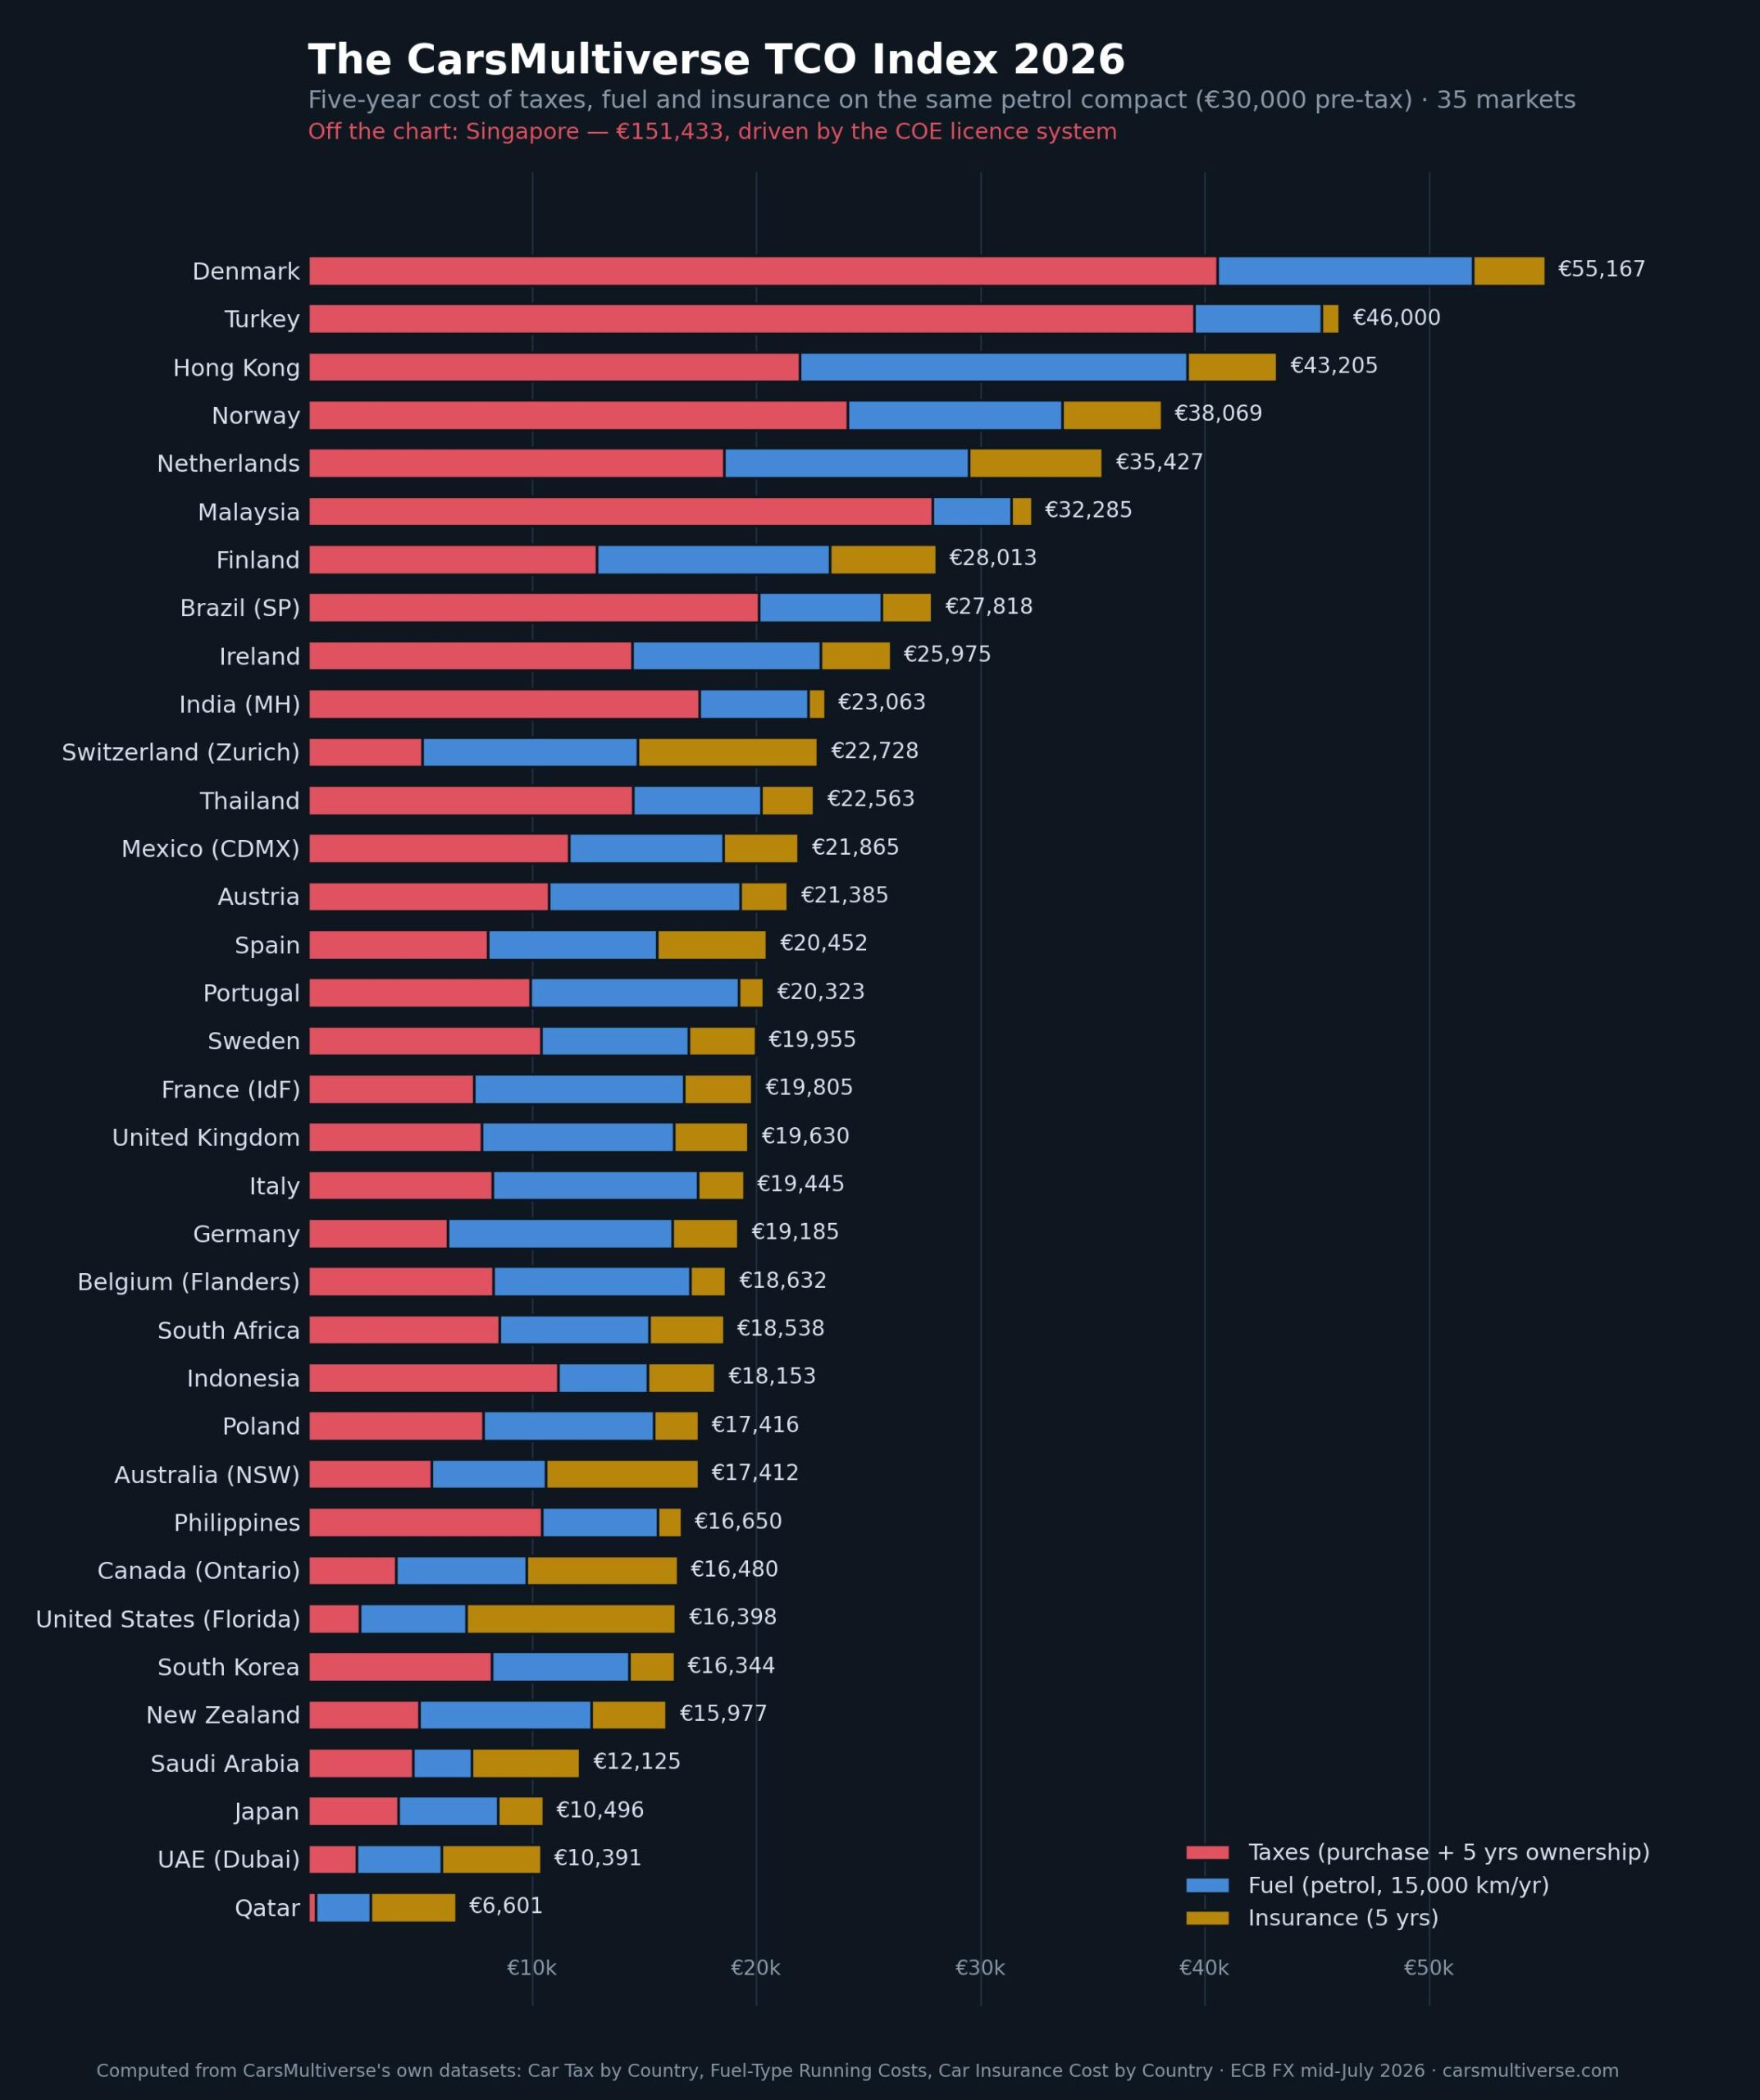
Keeping the same €30,000 petrol compact on the road for five years costs €151,433 in Singapore, €55,167 in Denmark — and €6,601 in Qatar. That is a 23-fold gap between the world’s most and least expensive places to run a car, before you even count the car itself. The CarsMultiverse TCO Index combines our own three datasets — car taxes, fuel costs and insurance premiums in 36 countries — into a single, directly comparable five-year figure. To our knowledge, no comparable multi-country index exists anywhere.
Key findings
• Singapore is in a league of its own: €151,433 over five years — about €30,000 a year, meaning the taxes, fuel and insurance cost the price of the car itself every 12 months. The COE licence (a record S$129,000 in July 2026) does most of the damage.
• Denmark (€55,167), Turkey (€46,000), Hong Kong (€43,205) and Norway (€38,069) complete the top five. Cheapest: Qatar (€6,601), UAE-Dubai (€10,391) and Japan (€10,496).
• What makes driving expensive is a different thing in each country. In Turkey taxes are 86% of the five-year bill and in Denmark 74%; in the United States insurance is the biggest cost (57% of the total); in Germany it’s fuel (52%); in Hong Kong petrol alone is €17,267 over five years — the world’s dearest pump prices.
• Europe’s big five cluster tightly: UK €19,630, Italy €19,445, Germany €19,185, France €19,805, Spain €20,452 — within 6% of each other, via completely different mixes of tax, fuel and insurance.
• Switching to an EV cuts the running-cost part (fuel + annual taxes) by up to €16,644 over five years in Hong Kong and €10,919 in Mexico City; EV purchase-tax advantages on top of that are in our tax study.
↓ Download the full index (CSV, free reuse with attribution)
The index: all 36 markets
| # | Country (region assumed) | 5-year total | Per year | Taxes (5 yrs) | Fuel (5 yrs) | Insurance (5 yrs) | EV running-cost saving (5 yrs) | Insurance figure note |
|---|---|---|---|---|---|---|---|---|
| 1 | Singapore | €151,433 | €30,287 | €137,192 | €9,881 | €4,360 | €4,742 | — |
| 2 | Denmark | €55,167 | €11,033 | €40,550 | €11,402 | €3,215 | €7,761 | — |
| 3 | Turkey | €46,000 | €9,200 | €39,515 | €5,690 | €795 | €5,830 | MTPL-only figure |
| 4 | Hong Kong | €43,205 | €8,641 | €21,938 | €17,267 | €4,000 | €16,644 | — |
| 5 | Norway | €38,069 | €7,614 | €24,045 | €9,584 | €4,440 | €7,412 | — |
| 6 | Netherlands | €35,427 | €7,085 | €18,557 | €10,910 | €5,960 | €8,978 | — |
| 7 | Malaysia | €32,285 | €6,457 | €27,845 | €3,510 | €930 | €3,013 | — |
| 8 | Finland | €28,013 | €5,603 | €12,890 | €10,373 | €4,750 | €8,114 | estimated (no official avg) |
| 9 | Brazil (São Paulo) | €27,818 | €5,564 | €20,091 | €5,477 | €2,250 | €3,684 | — |
| 10 | Ireland | €25,975 | €5,195 | €14,458 | €8,402 | €3,115 | €3,853 | — |
| 11 | India (Maharashtra) | €23,063 | €4,613 | €17,461 | €4,827 | €775 | €3,972 | — |
| 12 | Switzerland (Zurich) | €22,728 | €4,546 | €5,080 | €9,628 | €8,020 | €7,009 | — |
| 13 | Thailand | €22,563 | €4,513 | €14,492 | €5,716 | €2,355 | €4,474 | — |
| 14 | Mexico (CDMX) | €21,865 | €4,373 | €11,636 | €6,889 | €3,340 | €10,919 | — |
| 15 | Austria | €21,385 | €4,277 | €10,730 | €8,555 | €2,100 | €5,117 | MTPL-only figure |
| 16 | Spain | €20,452 | €4,090 | €8,020 | €7,552 | €4,880 | €4,990 | — |
| 17 | Portugal | €20,323 | €4,065 | €9,915 | €9,288 | €1,120 | €7,403 | — |
| 18 | Sweden | €19,955 | €3,991 | €10,390 | €6,580 | €2,985 | €6,680 | — |
| 19 | France (Île-de-France) | €19,805 | €3,961 | €7,410 | €9,340 | €3,055 | €6,261 | — |
| 20 | United Kingdom | €19,630 | €3,926 | €7,758 | €8,572 | €3,300 | €4,112 | — |
| 21 | Italy | €19,445 | €3,889 | €8,218 | €9,152 | €2,075 | €5,652 | MTPL-only figure |
| 22 | Germany | €19,185 | €3,837 | €6,215 | €10,020 | €2,950 | €6,044 | — |
| 23 | Belgium (Flanders) | €18,632 | €3,726 | €8,250 | €8,782 | €1,600 | €5,276 | MTPL-only figure |
| 24 | South Africa | €18,538 | €3,708 | €8,531 | €6,667 | €3,340 | €4,465 | — |
| 25 | Indonesia | €18,153 | €3,631 | €11,150 | €4,003 | €3,000 | €6,041 | estimated (OJK % tariff) |
| 26 | Poland | €17,416 | €3,483 | €7,830 | €7,596 | €1,990 | €5,006 | — |
| 27 | Australia (NSW) | €17,412 | €3,482 | €5,510 | €5,102 | €6,800 | €2,254 | — |
| 28 | Philippines | €16,650 | €3,330 | €10,435 | €5,150 | €1,065 | €2,895 | — |
| 29 | Canada (Ontario) | €16,480 | €3,296 | €3,929 | €5,821 | €6,730 | €4,452 | — |
| 30 | United States (Florida) | €16,398 | €3,280 | €2,308 | €4,740 | €9,350 | €2,695 | — |
| 31 | South Korea | €16,344 | €3,269 | €8,186 | €6,118 | €2,040 | €5,138 | — |
| 32 | New Zealand | €15,977 | €3,195 | €4,940 | €7,692 | €3,345 | €3,059 | — |
| 33 | Saudi Arabia | €12,125 | €2,425 | €4,672 | €2,638 | €4,815 | €2,058 | — |
| 34 | Japan | €10,496 | €2,099 | €4,019 | €4,452 | €2,025 | €2,050 | — |
| 35 | UAE (Dubai) | €10,391 | €2,078 | €2,160 | €3,811 | €4,420 | €2,921 | — |
| 36 | Qatar | €6,601 | €1,320 | €330 | €2,451 | €3,820 | €2,093 | — |
How the index works
The index answers one question: what does the state, the pump and the insurer take from you over five years if you run the same car in each country? The reference car is the one used across all CarsMultiverse studies: a new petrol compact, €30,000 pre-tax, 1.5-litre engine, 130 g CO2/km, ~1,400 kg, driven 15,000 km a year.
Taxes = the total first-year government take from our car-tax study (VAT/GST plus every acquisition tax) plus five years of annual ownership taxes. Fuel = five years of petrol at each country’s July-2026 pump price, from our fuel-type study. Insurance = five years at the average premium from our insurance study. All figures in euros at ECB mid-July 2026 rates. Where a country’s tax system is regional, the region assumed is shown in brackets (Florida, Ontario, NSW, Zurich, São Paulo, CDMX, Maharashtra, Île-de-France, Flanders, Dubai).
What it deliberately excludes: the car’s own price and depreciation (identical by construction and covered in our price-gap study), maintenance, parking, tolls and financing costs. The index measures the recurring cost environment, not the car.
Known limitations: for Italy, Austria, Belgium and Turkey the only reliable insurance average is mandatory-liability cover, so their totals are conservative; Finland’s and Indonesia’s insurance figures are clearly-flagged estimates (no official averages exist). The EV running-cost saving column compares energy costs plus annual taxes only — EV purchase-tax advantages are listed separately in the tax study.
FAQ
What is the CarsMultiverse TCO Index?
A single comparable figure for the five-year cost of taxes, fuel and insurance on an identical petrol compact in 36 countries, computed entirely from CarsMultiverse’s own published datasets. First edition: July 2026.
Why is Singapore so expensive?
The Certificate of Entitlement: a licence just to own a car, auctioned at a record S$129,000 (Category A) in July 2026. Add the ARF registration fee and excise, and taxes alone are €137,192 of Singapore’s €151,433 five-year total.
Which country is cheapest to run a car in?
Qatar: €6,601 over five years (€1,320 a year) — almost no taxes, the world’s cheapest petrol, and moderate insurance. The UAE and Japan follow at around €10,400–10,500.
Does the index include the car’s price or depreciation?
No — deliberately. The reference car is identical everywhere, so its price and depreciation would add the same amount to every country and blur the real differences, which come from taxes, fuel and insurance. Cross-country price differences for actual models are covered in our EV price-gap study.
Explore the underlying data
• Car tax by country 2026 · Fuel-type running costs in 36 countries · Car insurance cost by country 2026
• Home EV charging price index · Same EV, different price
• True cost of ownership calculator (your own numbers, any currency)
• All research & data
Disclaimer & reuse. This index is for information only and is not financial advice; it is a modelled comparison built on averages, and any individual’s costs will differ. Verify taxes and premiums with official bodies and insurers. Charts, tables and the CSV are free to reuse with attribution and a link (CC BY 4.0). See our Terms of Service.